This year our VIP team’s research focus is on data that we've collected through Georgia Tech's online platforms. This includes mass-market courses hosted on Coursera, our online masters programs on edX and data from Canvas, the learning management system that services both our online and on-campus courses. To introduce the students to learning analytics using data from online platforms, we hosted Dan Davis, a PhD student from the Delft University of Technology in the Netherlands.

Every year, the C21U research team hosts a group of students as part of Georgia Tech’s Vertically Integrated Projects (VIP) program. VIP brings students with diverse backgrounds together to work closely with faculty on cutting edge research. In past semesters, our students have created a tool that uses machine learning to improve peer reviews (with working front- and back-ends), used big-data analytics on clickstream data to understand student behavior for Georgia Tech's Language Institute, and have created algorithms to adjust grade distributions to ensure fair grading in MOOCs.
This year our VIP team’s research focus is on data that we've collected through Georgia Tech's online platforms. This includes mass-market courses hosted on Coursera, our online masters programs on edX and data from Canvas, the learning management system that services both our online and on-campus courses. To introduce the students to learning analytics using data from online platforms, we hosted Dan Davis, a PhD student from the Delft University of Technology in the Netherlands.
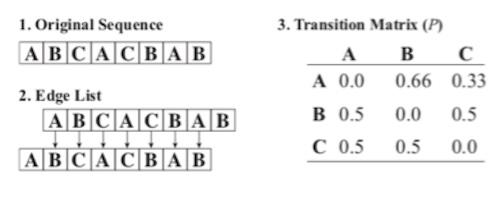
A focus of Dan's research is on how to model the structure of a course mathematically. Learning how to do this will allow our student researchers to measure how course structure affects student performance, engagement, or any other factor that we're interested in. Dan imagines a course as a sequence of steps, beginning with the first chapter of a course then proceeding to a subsection then maybe there's a video to watch, then some text, some problems, then another video, etc. By counting how many times a course changes from one element to another we can construct a matrix of transition probabilities that represents the structure of the course. This process is illustrated below from Figure 3 in Dan's paper:

The data from individual courses can be pretty noisy. A course can have thousands of elements or possibly only a handful, depending on the design goals of the instructor. Luckily, there are thousands of MOOCs (one estimate is over 8 thousand) and more are created every day. To make things more manageable, Dan uses clustering to group courses that have similar structures together. This allows us to take a lot of noisy data and transform it, revealing common themes in MOOC course design.

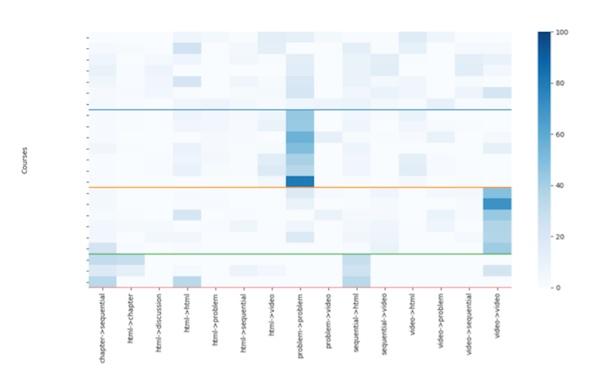
The diagram above represents the structure of some of Georgia Tech's edX course offerings. On the horizontal axis is the transition from one element to another. Each tick on the vertical axis represents an individual course. The blue colors represent the probability of transitioning from one element to another, with the scale on the right. Using a clustering algorithm, we've placed the courses into four groups with similar structures as denoted by the horizontal lines. The three courses in the bottom cluster have many chapter->sequential (sequential is a subsection) transitions and sequential->html transitions. These are relatively sparse courses with some html, usually text, explaining the content. The next group up is mostly videos. The group second from the top is very problem focused. The defining feature of the top-most group is that there is no defining feature, these courses use a wide variety of content.
We’ve learned that these courses are complex, with a wide range of elements, problem focused, video focused, or text focused. A learner might have a preference for one of these types, which might help them decide which MOOC to pursue. An administrator might wish to compare their course’s structures to another university’s courses. For now, it’s hard to tell how course structure affects learning outcomes.
Dan found that students who take complex Harvard edX courses tend to finish the courses more frequently than students who take Harvard’s text-focused courses. However, this could be due to some other underlying effect. Regardless, it’s techniques like these that will allow us to understand the vast amounts of data coming from online course offerings and give us a better understanding of the learning process.
(text and background only visible when logged in)